Survey Says! The Price is Right for Investors
The P/E Ratio and Its Evolution

The Price Is Right is a long-running and beloved game show where contestants attempt to guess the prices of everyday products to win fabulous prizes. In the investing world, a similar game plays out as investors strive to estimate the “right price” for the stock market. The stakes are even higher, with the prize being superior long-term investment performance and the magic of compounding growth.
While game show contestants rely on intuition and shopping experiences to make their guesses, investors must dig deeper into the data and analysis. Even with a thoughtful approach, the conclusions can sometimes be misleading. Let’s spin the big wheel on one of the most misunderstood metrics in the financial world—the Price-to-Earnings (P/E) ratio—and uncover why it’s often treated as a guessing game, even by seasoned pros.
Changing Times, Changing Metrics
Just as the cost and quality of products like automobiles have transformed over the decades, the stock market and its metrics have evolved as well. In the 1960s, cars and trucks were primarily made of steel, ran on gasoline, and had a lifespan of around 100,000 miles. Today, they’re built with advanced materials, feature hybrid or electric powertrains, and often last twice as long.
Similarly, the S&P 500 has undergone dramatic changes. When you’re shopping for a car, how do you know if you’re getting a good deal? What constitutes fair value? Investors face the same dilemma in the market: Is the market cheap or expensive?
The P/E ratio has long been the “Plinko chip” of market valuation—a seemingly simple and handy tool for gauging market value. However, its usage has evolved over time, shaped by economic cycles, investor sentiment, and significant shifts in sector composition.
As of November 22, 2024, the next 12-month P/E ratio for the S&P 500 stands at 22.03, compared to its 30-year average of 16.73 (source: JP Morgan). But does this number mean the market is overpriced? Or is it time to “come on down” and rethink the relevance of historical P/E comparisons?
What is the P/E Ratio?
At its core, the P/E ratio is a tool for determining how much investors are willing to pay for each dollar of a company’s earnings. It’s calculated simply by dividing the stock or index price by its earnings per share (EPS).
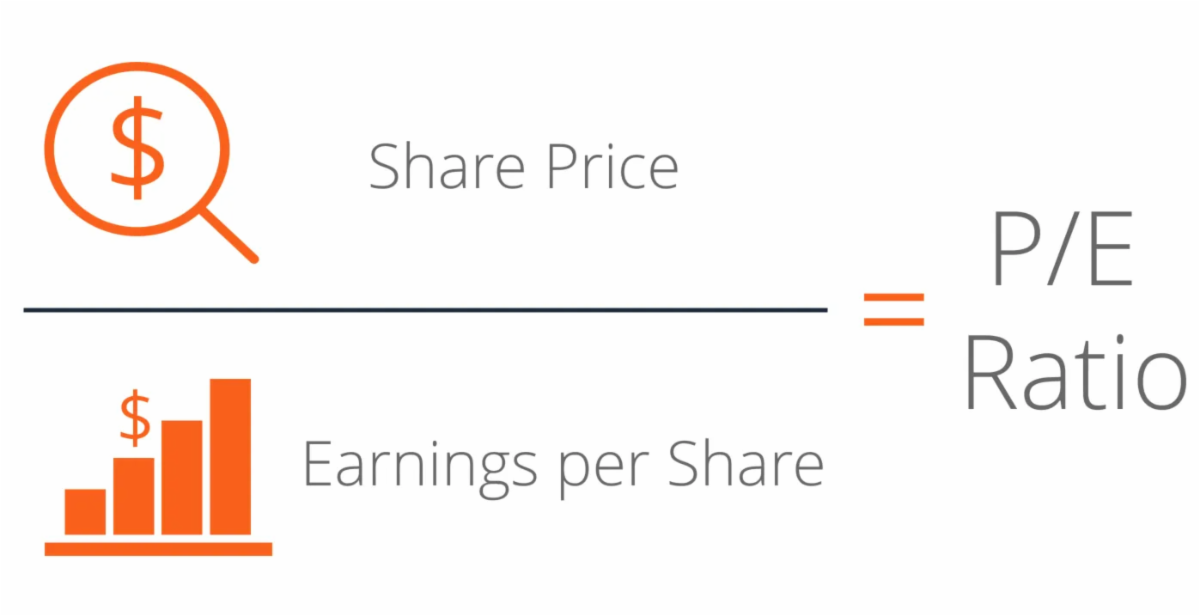
Source: FactSet as of 11/22/2024
The S&P 500 Index P/E Calculation
5969.34 (Market Price) / 270.96 (Estimated Earnings) = 22.03
It’s like bidding on Contestant’s Row—guessing the price of a product. But without understanding the underlying factors, your bid could leave you over or under the mark.
A Historical Perspective
Traditionally, the average P/E ratio hovered between 16 and 20, a range considered “normal” for the market. Below 16 was deemed a bargain, while above 20 suggested overvaluation. However, the factors driving market valuation have changed significantly:
- Economic Cycles: Just as contestants adjust their bid for seasonal discounts, P/E ratios contract during recessions and expand in boom periods.
- Interest Rates: Lower interest rates are like a surprise sale—boosting the value of future earnings and justifying higher P/E ratios.
- Technological Advancements: New high-growth industries like tech and biotech command higher multiples due to their growth potential.
- Globalization: Global markets add new opportunities for revenue growth, pushing P/E ratios higher.
The Evolution of the S&P 500
When the S&P 500 launched in 1957, its lineup was dominated by slow and steady growth sectors like industrials, utilities, and railroads. Today, high-growth tech giants like Apple, Nvidia, Amazon, and Google have taken center stage. As seen in the image below, the weighting of higher growth sectors has steadily increased over time. These high-growth sectors command a higher P/E multiple.
Sector Composition of S&P 500 Over Time (1975-2024)
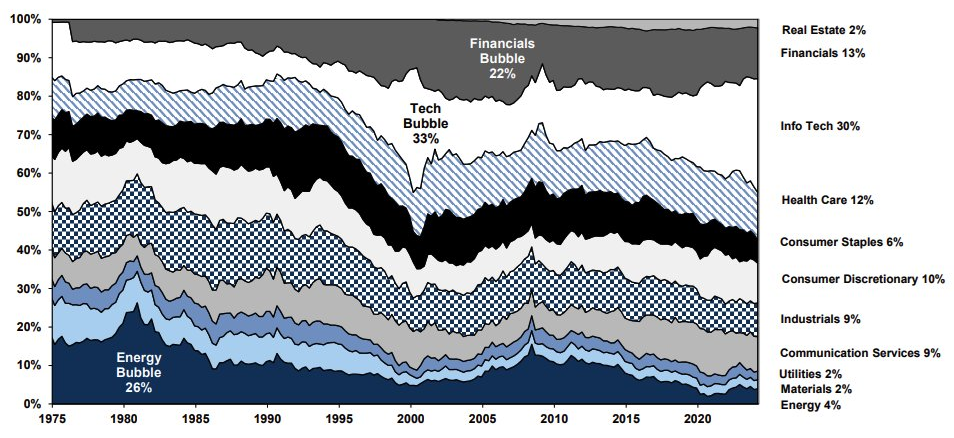
Source: Compustat, FactSet, Goldman Sachs Global Research
Redefining "Technology"
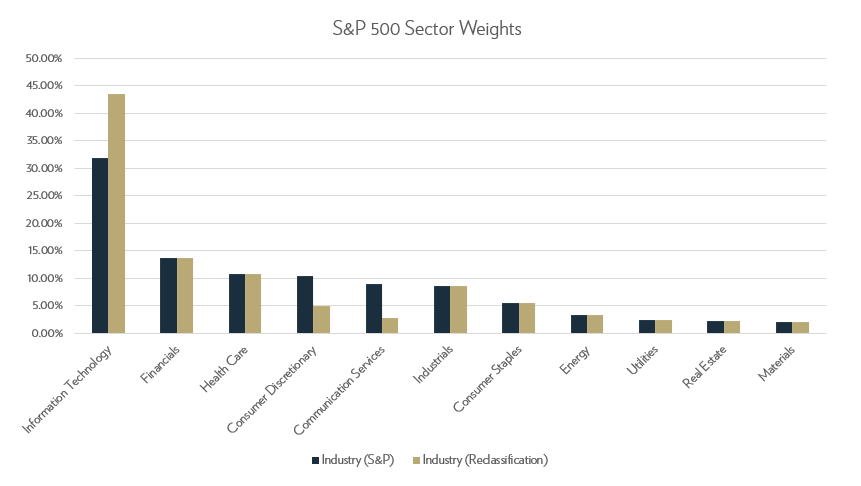
For example, did you know that Amazon and Tesla are categorized as consumer discretionary stocks? Or that Google, Meta, and Netflix fall under Communication Services? These reclassifications highlight how tech-driven the market has become—and why traditional P/E benchmarks may no longer provide an accurate measure of valuation.
The Bigger Picture
Just like The Price Is Right teaches contestants that guessing without context can lead to failure, investors who rely on outdated P/E metrics risk being left behind. The market has changed. Today’s economy is driven by technology and innovation, and the old benchmarks are becoming as obsolete as a 1970s rotary phone.
Winning the investment game means adapting to new rules. Understanding the factors driving today’s valuations—technology’s dominance, sector reclassification, and evolving growth expectations—equips investors to make smarter decisions.
So, before you place your bid on the market, remember: the real price is right when you’ve done your homework and understand the game.
Principle Wealth