Costly Living

Source: Reddit, the_real_CJP64
The cost of living in the United States is often presented as a straightforward number, but in reality, it’s a complex and deeply personal experience shaped by lifestyle, location, and individual spending habits. Government measures like the Consumer Price Index (CPI) and the Personal Consumption Expenditures Price Index (PCE) are designed to track inflation and cost trends across the economy. Yet these broad indexes rarely capture how inflation actually feels to the average household or how unevenly it can affect different families. As the Federal Reserve moves closer to easing monetary policy through potential rate cuts, it’s worth asking: do the government’s measures of inflation truly reflect the day-to-day reality of consumers?
The Average Household
Average U.S. Consumer Spending Snapshot
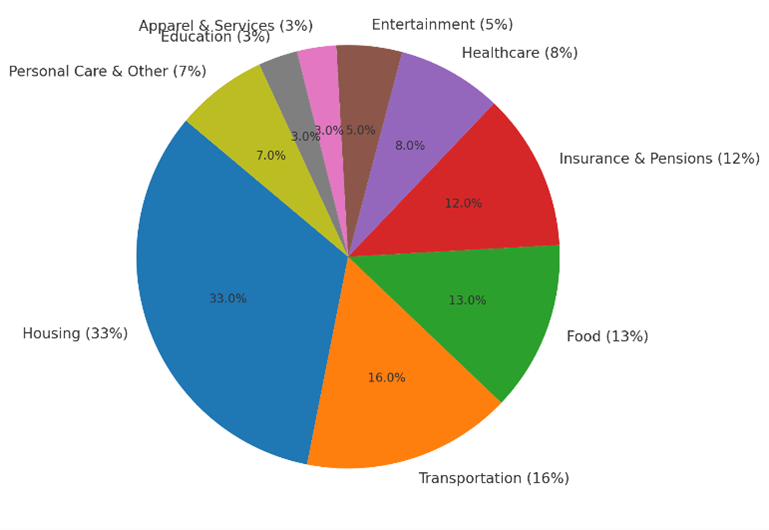
Source: Bureau of Labor Statistics
The phrase “average household” in the U.S. doesn’t describe an actual family, but rather an aggregate profile constructed from household income, spending, and demographics. Economists, policymakers, and businesses use this composite to generalize patterns of demand and behavior across the economy.
Snapshot of the “average household” in 2023:
- Median household income: about $78,000 per year
- After taxes: roughly $66,000–$70,000
- Household size: 2.5 people
- Homeownership rate: about 65
Spending breakdown as a % of disposable income:
- Housing: ~33% (rent/mortgage, utilities, maintenance)
- Transportation: ~16% (car payments, insurance, fuel, transit)
- Food: ~13% (groceries and dining out)
- Healthcare: ~8%
- Insurance & pensions: ~12% (Social Security, retirement savings)
- Other categories: entertainment, apparel, education, personal care, and more
Source: Bureau of Labor Statistics, Bureau of Labor Statistics Consumer Expenditure Survey
Government Metrics
U.S. CPI Weights by Major Category (Dec 2024)
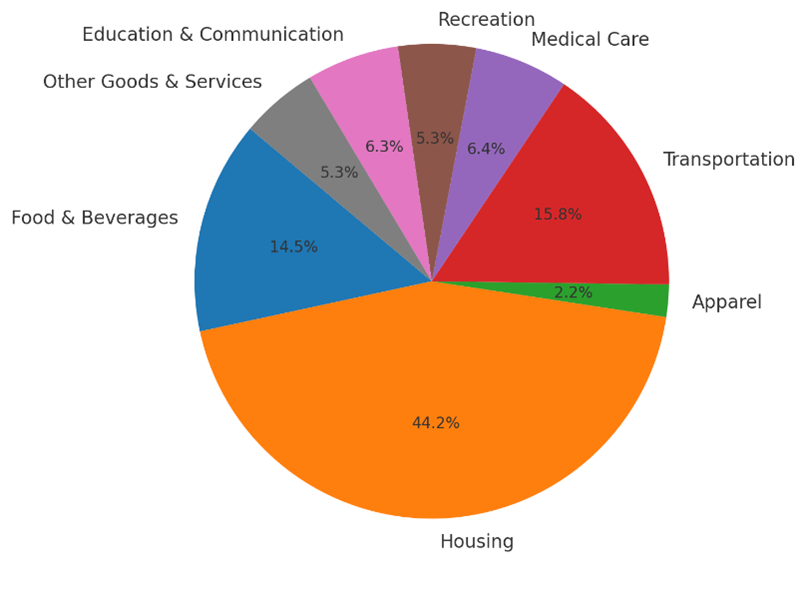
Source: Bureau of Labor Statistics
At the federal level, two key measures dominate inflation discussions: CPI and PCE.
The Consumer Price Index (CPI), published by the Bureau of Labor Statistics, tracks the average change over time in prices paid by urban consumers for a defined “basket” of goods and services, housing, transportation, food, healthcare, and education, among others.
The Personal Consumption Expenditures (PCE) Index, maintained by the U.S. Department of Commerce and favored by the Federal Reserve, is broader in scope and adjusts more quickly to shifts in consumer behavior. Because it captures substitution effects, which show how consumers switch to alternatives when prices rise, it often differs from the CPI.
As of July 2025, headline CPI inflation stood at 2.7% year-over-year, while headline PCE inflation was 2.6%. Both confirm that inflation has eased significantly from the highs of the past two years.
These metrics guide monetary policy, determine cost-of-living adjustments for Social Security, influence the tax code, and more. Still, they remain averages, useful but blunt instruments that cannot fully capture the nuanced, lived experience of American households.
What's Your Inflation Rate?
Cumulative Price Increases in US over the Last 5 Years
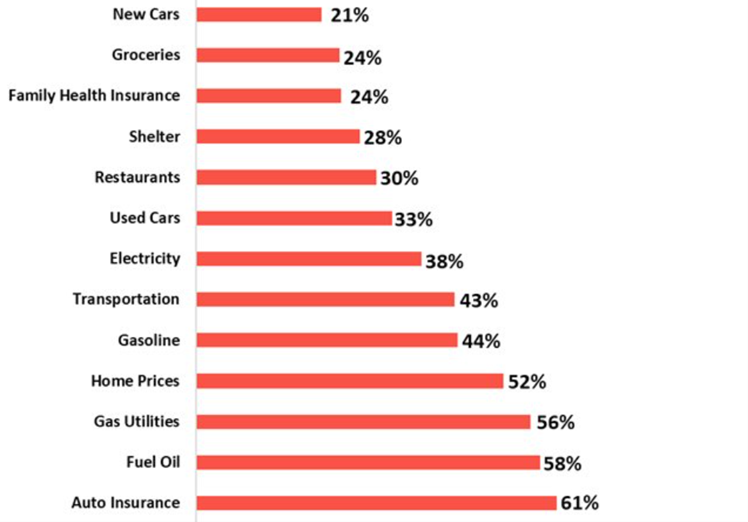
Source: YCharts as of July 31st, 2025
Brand preference also plays a role. Consumers who choose brand-name products over generics or luxury services over basic alternatives may experience significantly higher “personal inflation” even when headline CPI numbers remain low. This speaks to a growing truth: lifestyle choices increasingly define one’s cost of living more than just price hikes on essential goods.
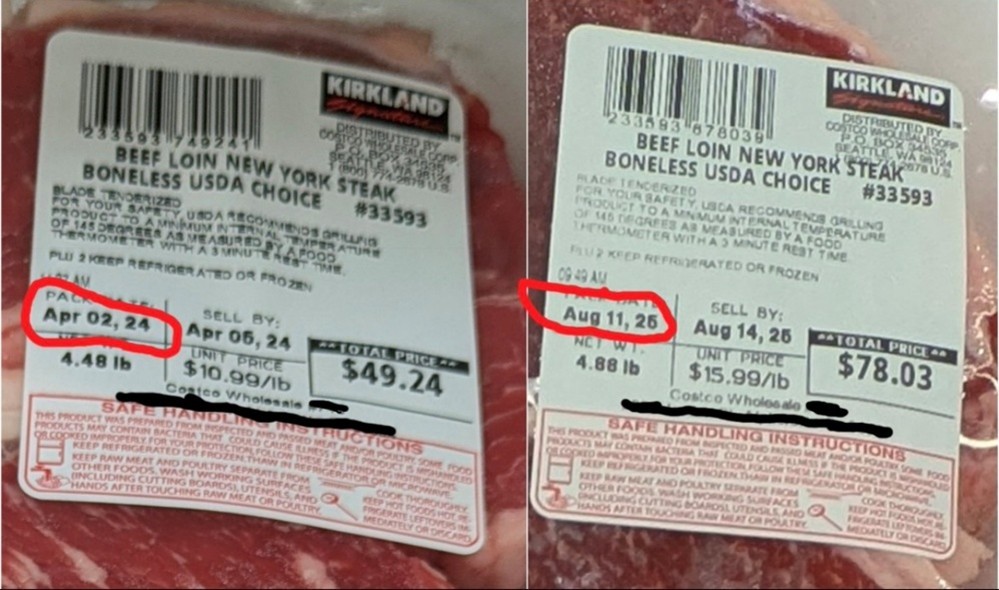
Source: X (Consumer Picture)
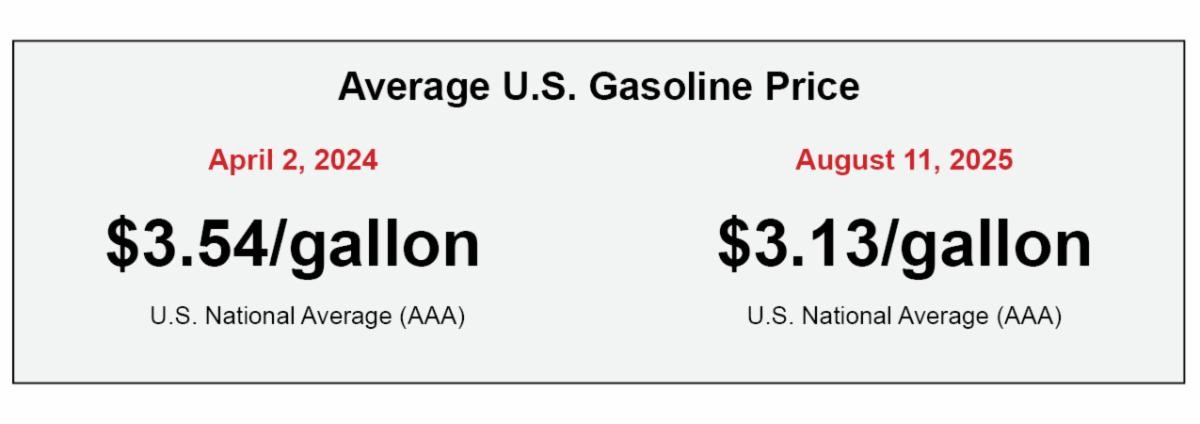
Source: AAA Gas Prices (national average, regular unleaded)
Track Your Data
Inflation metrics may guide policy, but they often fail to reflect individual realities. Policymakers might view a 3% inflation rate as “moderate,” yet for a single parent facing a 20% increase in childcare costs, it feels anything but. Truly understanding the cost of living requires more than numbers; it involves awareness of the diverse experiences that define modern American life.
For many households, the reality is simple: your personal inflation rate is likely higher than what the government reports suggest. And if your savings or investments don’t keep pace, the result is negative real returns over time.
That’s why we encourage clients to review their spending on an annual basis. Calculate your personal rate of inflation and compare it both to government figures and to your own prior year figure. Is it higher or lower? How has it changed? In our experience, we’ve yet to meet anyone whose personal inflation rate lines up neatly with official government measures.
The goal is not just to spend wisely, but to place what remains in assets that can outpace inflation, helping you preserve purchasing power and protect your long-term financial future.
Principle Wealth